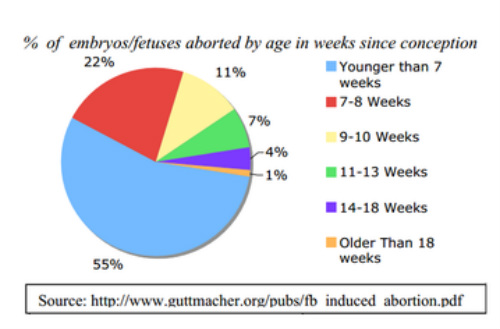
This pie graph shows that while only one percent occur during the third trimester of pregnancy, it still amounts to thousands of abortions occurring at a stage when an unborn child can survive outside of the womb.
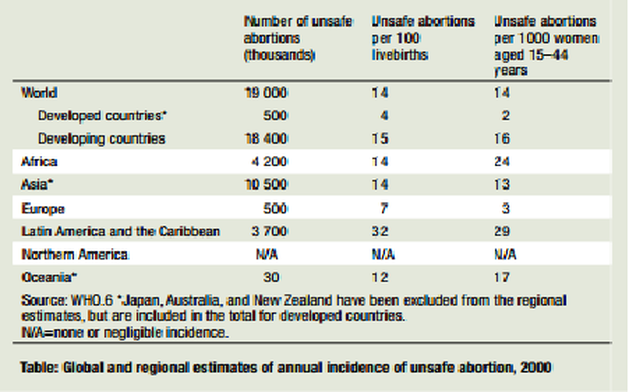
Worldwide estimates for 1995 indicated that about 26 million legal and 20 million illegal abortions took place every year. Estimates show that women in South America, eastern Africa, and western Africa are more likely to have an unsafe abortion than are women in other regions. Unsafe abortion rates per 1000 women aged 15–44 years provide a more comparable measure of unsafe abortion by region.
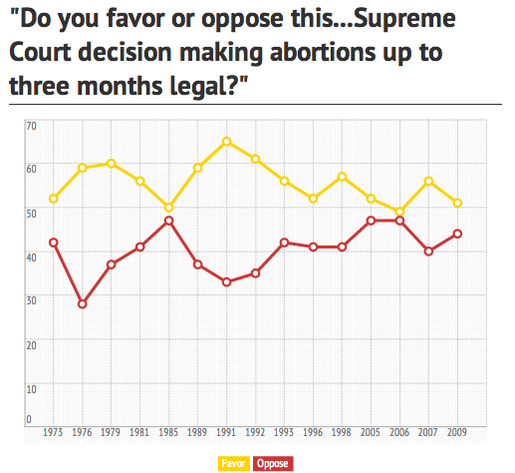
Roe v. Wade saw its highest approval ratings in the early 1990s. This was around the time when the Supreme Court issued another decision on abortion, Planned Parenthood v. Casey, which ruled that certain restrictions on abortion access, like waiting periods, were constitutional. I included the survey answering the question, "Do you favor or oppose this... Supreme Court decision making abortions up to 3 months legal?" because this shows that the Roe v. Wade case is still a very controversial topic in the U.S. As of 2009, the votes were so close together just like how it was in 1973. The closest votes have been, from 1973 to 2009 was in 2006
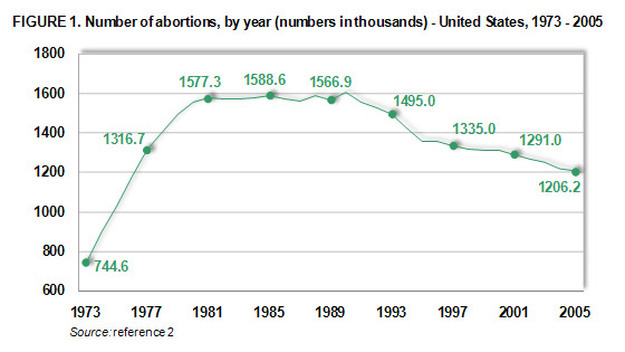
This line plot shows the number of abortions in the United States from 1973, Roe. V. Wade ruling, to 2005. The number of abortion has gone up significantly in the matter of 4 years (1973-1977). In a way, abortion helps our population to be controlled.
This graph is related to maternal deaths during abortion and other pregnancy related causes. This graph is not pertaining to the United States. But just by looking at the dark pink bars, it is logical to conclude that it was most likely safer for women while abortion was legal. From 1989 to 1990 there was a difference of 92 maternal deaths. That is a major difference!
